.png)
Rook Ceph Dashboard
Rook Ceph Dashboard Login
Rook Ceph Cluster provides a Dashboard which can be accessed from the UI in the Application Dashboards tab inside Kommander.
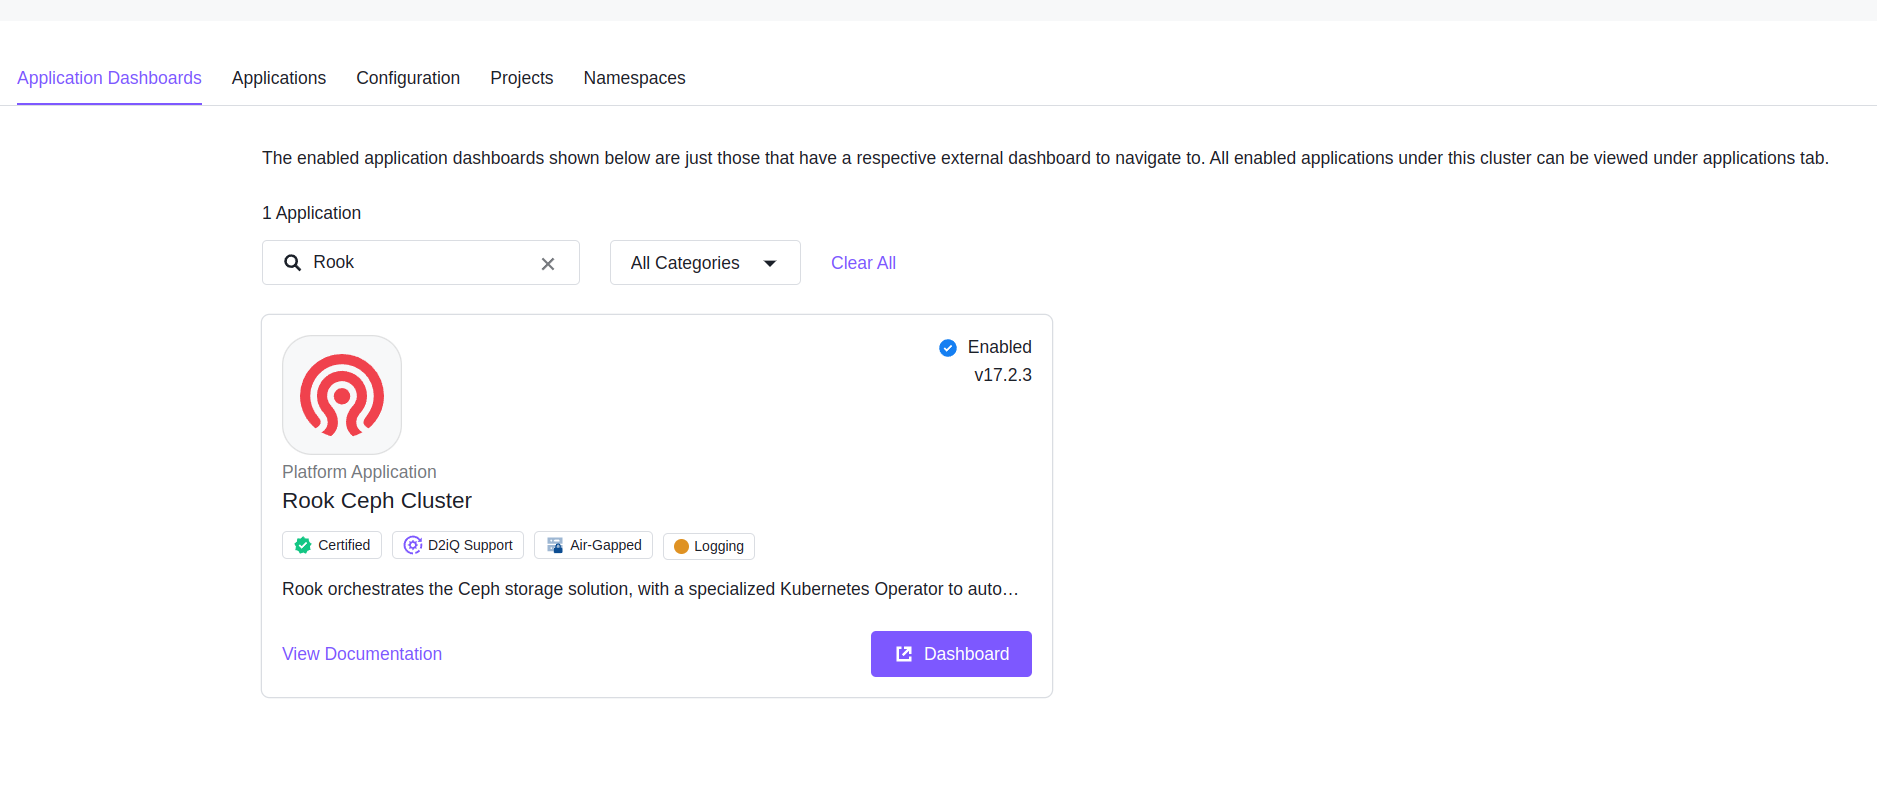
Rook Ceph Dashboard Link in the UI
The dashboard can be used to view current cluster health and logs.
How to Access the Rook Ceph Dashboard
Go to the applications dashboard
Select the Dashboard button
Username is
adminTo retrieve your password, in the command line and using the kubeconfig of the Kubernetes cluster you have Rook Ceph deployed to, run the following command:
NOTE: Set the NAMESPACE variable according to your environment (kommanderon management cluster or workspace namespace on attached clusters and managed clusters).CODEkubectl get secret -n ${NAMESPACE} rook-ceph-dashboard-password -ogo-template="{{.data.password|base64decode}}"Copy the password and paste it into the UI to access the dashboard. After successful login, a
HealthyRook Ceph Cluster dashboard will look similar to:
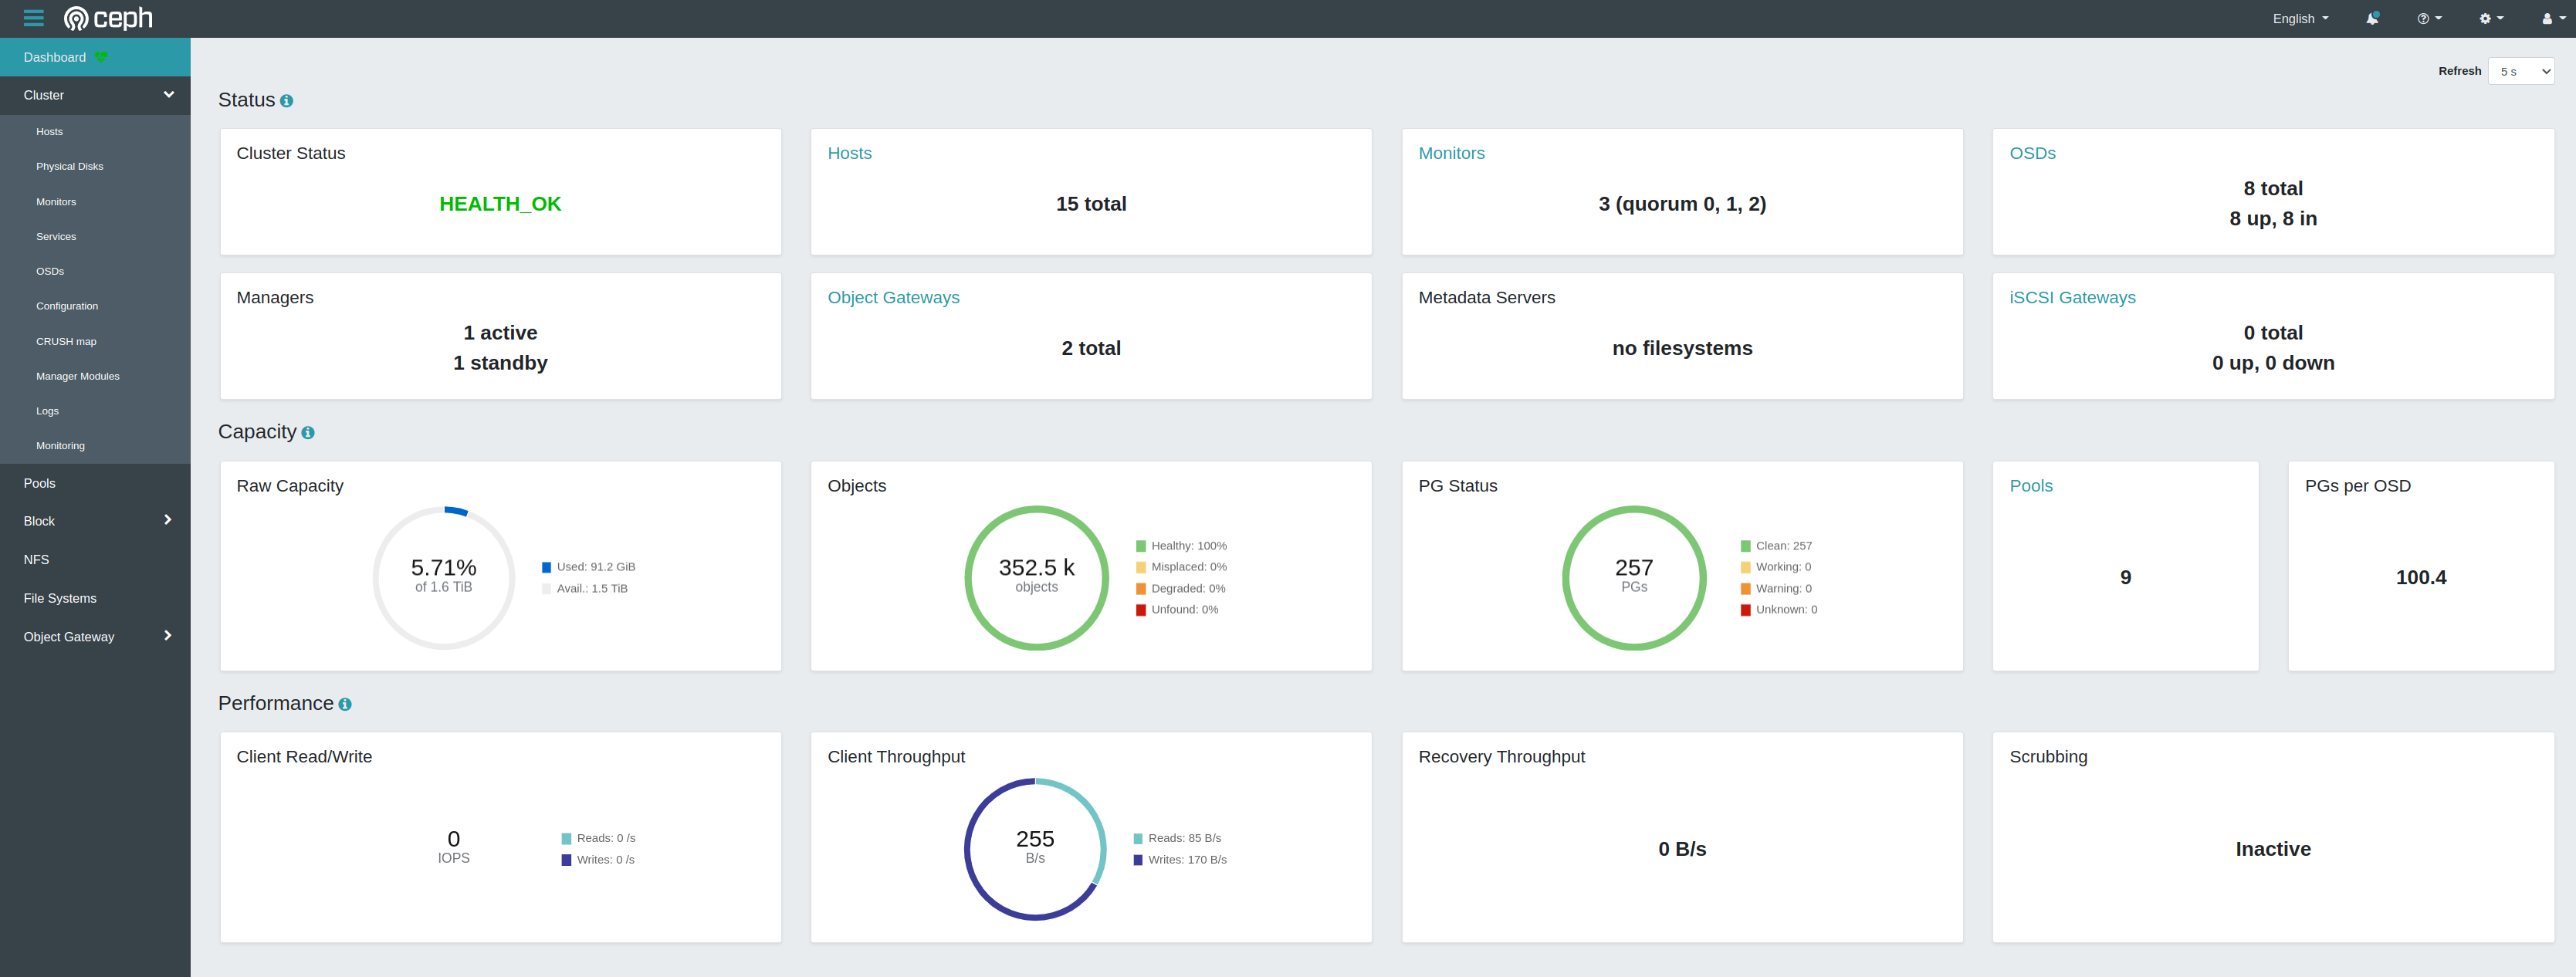
Rook Ceph Cluster Dashboard